

What the Machine Eats
Issue 02 — July 2026

1. The Month in Context
There is a category error at the center of how the AI revolution is being discussed. The models are software, so the conversation is too: parameters, training runs, the race between labs. Valuation debates turn on which software company captures which market, economic forecasts on which industries the software reshapes.
But the infrastructure that makes the software possible is not software. It is copper and concrete and steel — transformer cores, transmission lines, cooling systems, reactor fuel. A physical machine of considerable size, and the machine is hungry.
The hyperscalers have made the scale of the appetite explicit. Their capital-expenditure commitments are signed contracts, not projections: equipment orders, land reservations, grid interconnection agreements, and — most recently — twenty-year purchase agreements for nuclear power plants. These orders are already in the world, and they will be honored regardless of what happens to any company’s stock price. The physical consequence of the AI investment cycle cannot be called back.
Rarely does that conversation reach the bill of materials. The demand is real and locked in; the question is whether the physical world — the mines, the grids, the refineries — can keep pace. The answer, across the three commodities at the core of the build-out, is no. Not within the decade. Perhaps not within two.
The issue preceding this one examined what the equity market stopped doing. This one examines what the physical economy cannot do fast enough — and what that constraint means for the transition underway.
2. The Macro Dashboard
Four indicators frame the physical dimension of the AI build-out. The first describes the scale of the power requirement. The next three show the state of the materials needed to meet it.
Electricity — the forcing function. Two numbers measure the appetite, and they are not the same number. Energy — the total drawn over a year, in terawatt-hours — ran to 183 TWh for American data centers in 2024, roughly 4% of US electricity demand, and reaches 426 TWh on the 2030 midpoint estimate, a 133% rise in six years. Power — the load the grid must deliver at any single instant, in gigawatts — is the tighter constraint, because the grid is sized to the peak, not the average: the Department of Energy and Goldman Sachs put peak data-center demand at 66 GW by 2027, nearly double the 31 GW of 2025. NERC, the body responsible for North American grid reliability, projects summer peak rising by 224 GW over the next decade and attributes the majority of that growth to data centers and artificial intelligence. The high-risk regions it names — PJM, MISO, ERCOT — are the grids serving the eastern seaboard, the Midwest, and Texas.
The grid has not kept pace, and the component making that visible most plainly is the transformer. Power transformers have lead times of 128 weeks for standard units, 144 weeks for generator step-up models. Two and a half years, from order to delivery, against roughly twelve months five years ago. Prices are up 77% since 2019. Goldman Sachs estimates that closing the infrastructure gap requires $720 billion of grid investment by 2030; the 47 largest investor-owned utilities have announced more than $1 trillion in combined capital expenditure through 2029. The AI infrastructure conversation usually ends at the chip. The current bottleneck is the transformer.
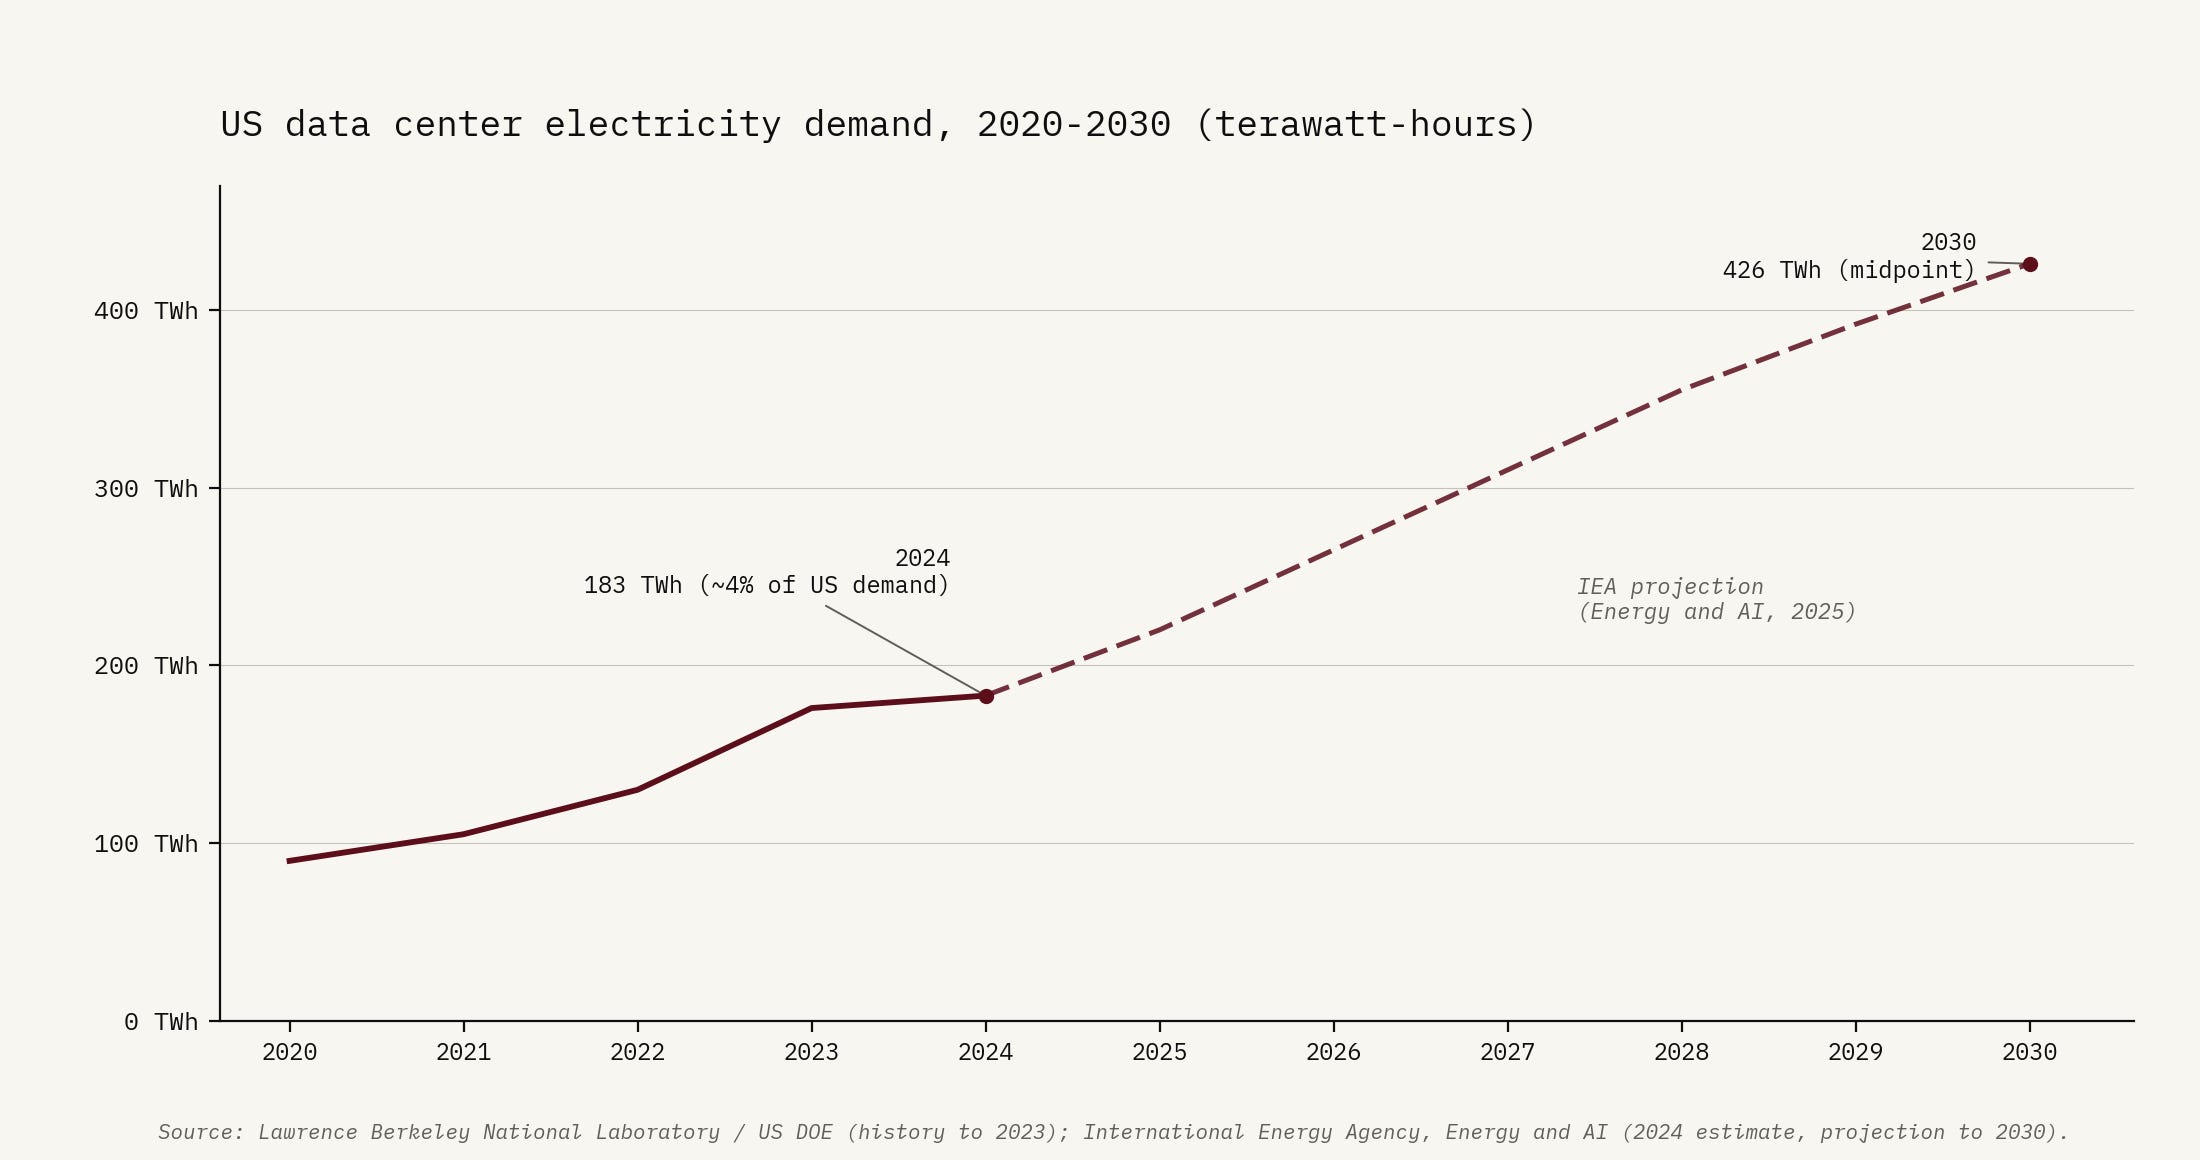
US data center electricity demand, 2020–2030 (terawatt-hours)
Copper — the gap that opens. Building that infrastructure takes copper on a scale the mining industry is not built to supply. A single hyperscale data center swallows roughly 27 tonnes of it per megawatt of installed capacity — in the cabling and busbars, the cooling loops, the windings of every transformer. And it lands on a market already set to fall short of its baseline: Wood Mackenzie’s 2025 analysis has total demand reaching 42.7 million tonnes a year by 2035 against current mine production of 23 million, and even the optimistic supply path lifts output only to 28.9 million by 2030 — the International Energy Agency puts the resulting shortfall at 30% of demand. AI is not the bulk of that demand; it is the marginal tonne. The roughly 1.1 million tonnes a year it adds by 2030 is small against the 42.7 but decisive against the shortfall: on a market that cannot meet its baseline, it is the last increment of demand that sets the clearing price, and it arrives on a supply curve that cannot bend to meet it. The mines cannot move at that speed.
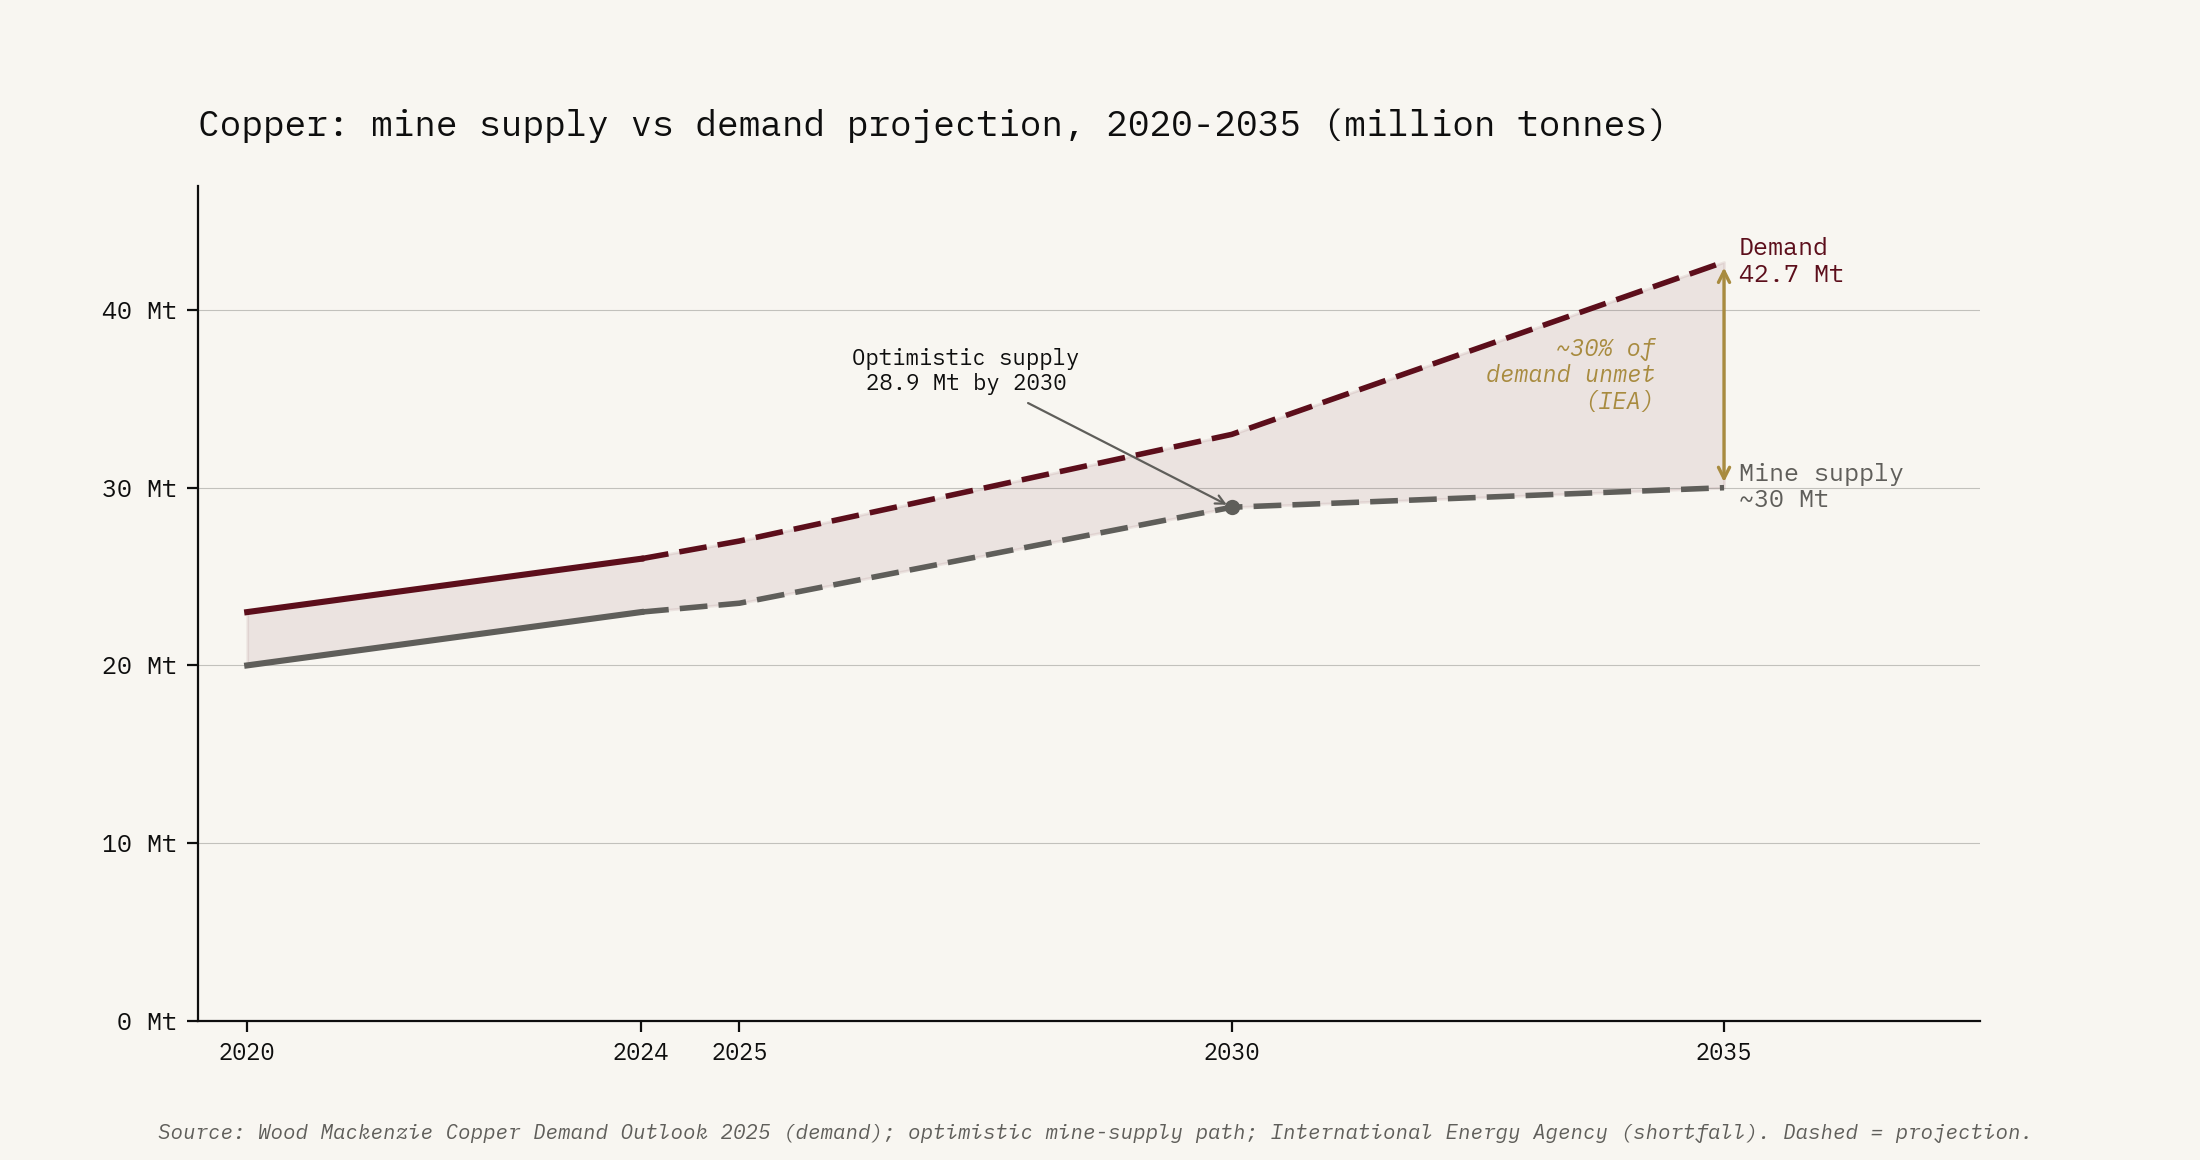
Copper: mine supply vs demand projection, 2020–2035 (million tonnes)
Silver — the experiment already run. Here the future has already happened. For five years the solar build-out has been a live test of what occurs when locked-in industrial demand meets a supply base that cannot stretch — and the results are filed. Photovoltaics tripled their silver draw over the past decade; the market has now booked five straight annual deficits, 762 million ounces pulled from above-ground stocks since 2021 on the Silver Institute’s 2026 accounting. Price followed inventory: silver has more than doubled since the start of last year and trades in the low $60s as this issue goes out, clear of its 1980 and 2011 highs. What happened next is the part copper and uranium have not yet lived through — and it is where the deep dive picks the story up.
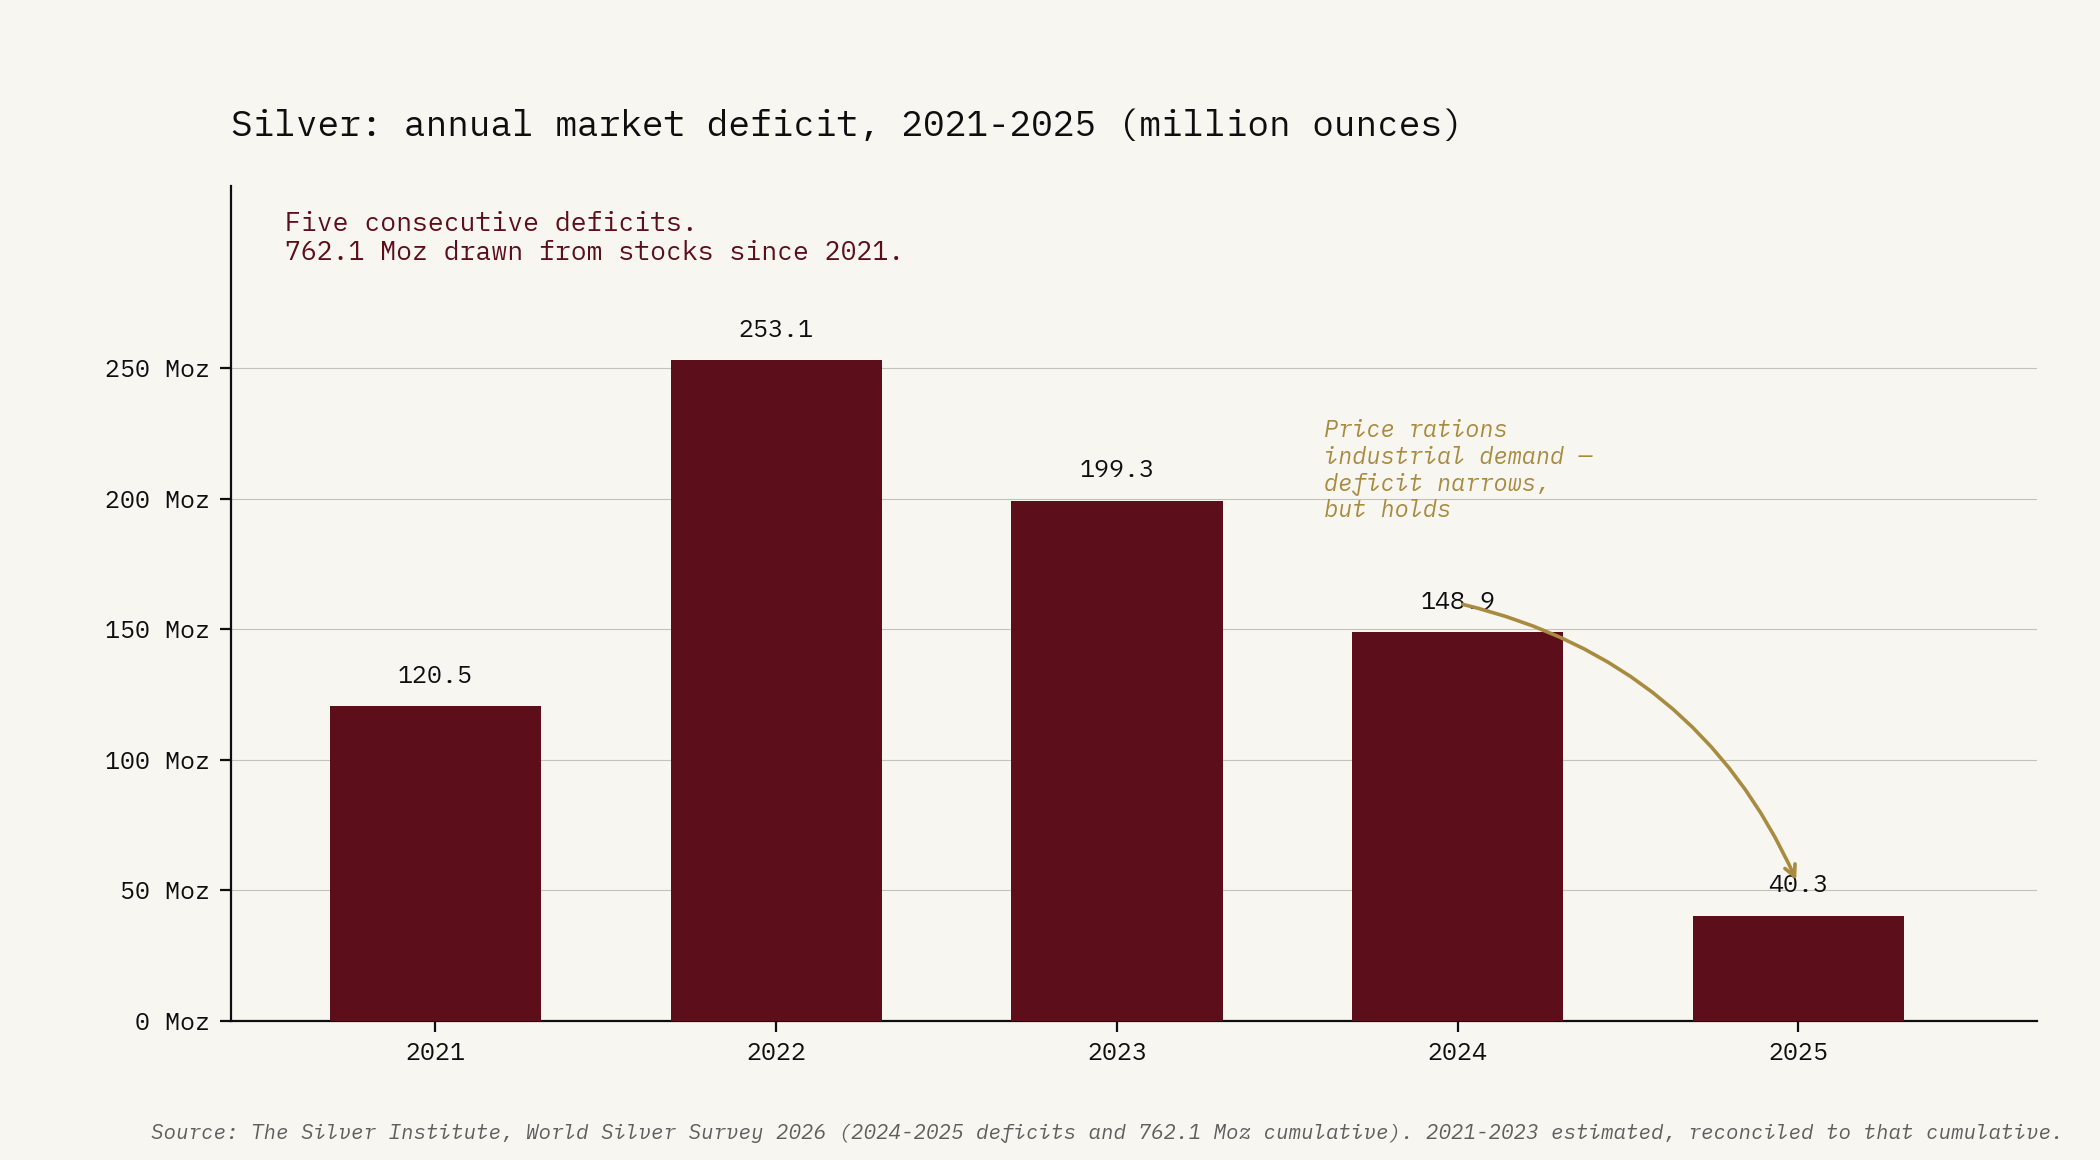
Silver: annual market deficit, 2021–2025 (million ounces)
Uranium — the 16-gigawatt signal. Data centers need power that never blinks, and neither sun nor wind can promise that at scale. The hyperscalers worked that out for themselves and signed accordingly. Microsoft has contracted 835 megawatts from a restarted Three Mile Island for twenty years — a restart its counterparty Constellation is funding to the tune of $1.6 billion, with the plant due back in service in the second half of 2027. Amazon has locked in 1,920 megawatts from the Susquehanna nuclear station through 2042. Google has agreements with Kairos Power for up to 500 megawatts of small modular reactors, first unit targeted for 2030. Meta has committed to 1.1 gigawatts from Constellation and flagged up to 6.6 more across existing plants and advanced designs. Add the sector’s smaller deals around these four, and the contracted total clears 16 gigawatts. Every one of those gigawatts runs on uranium.
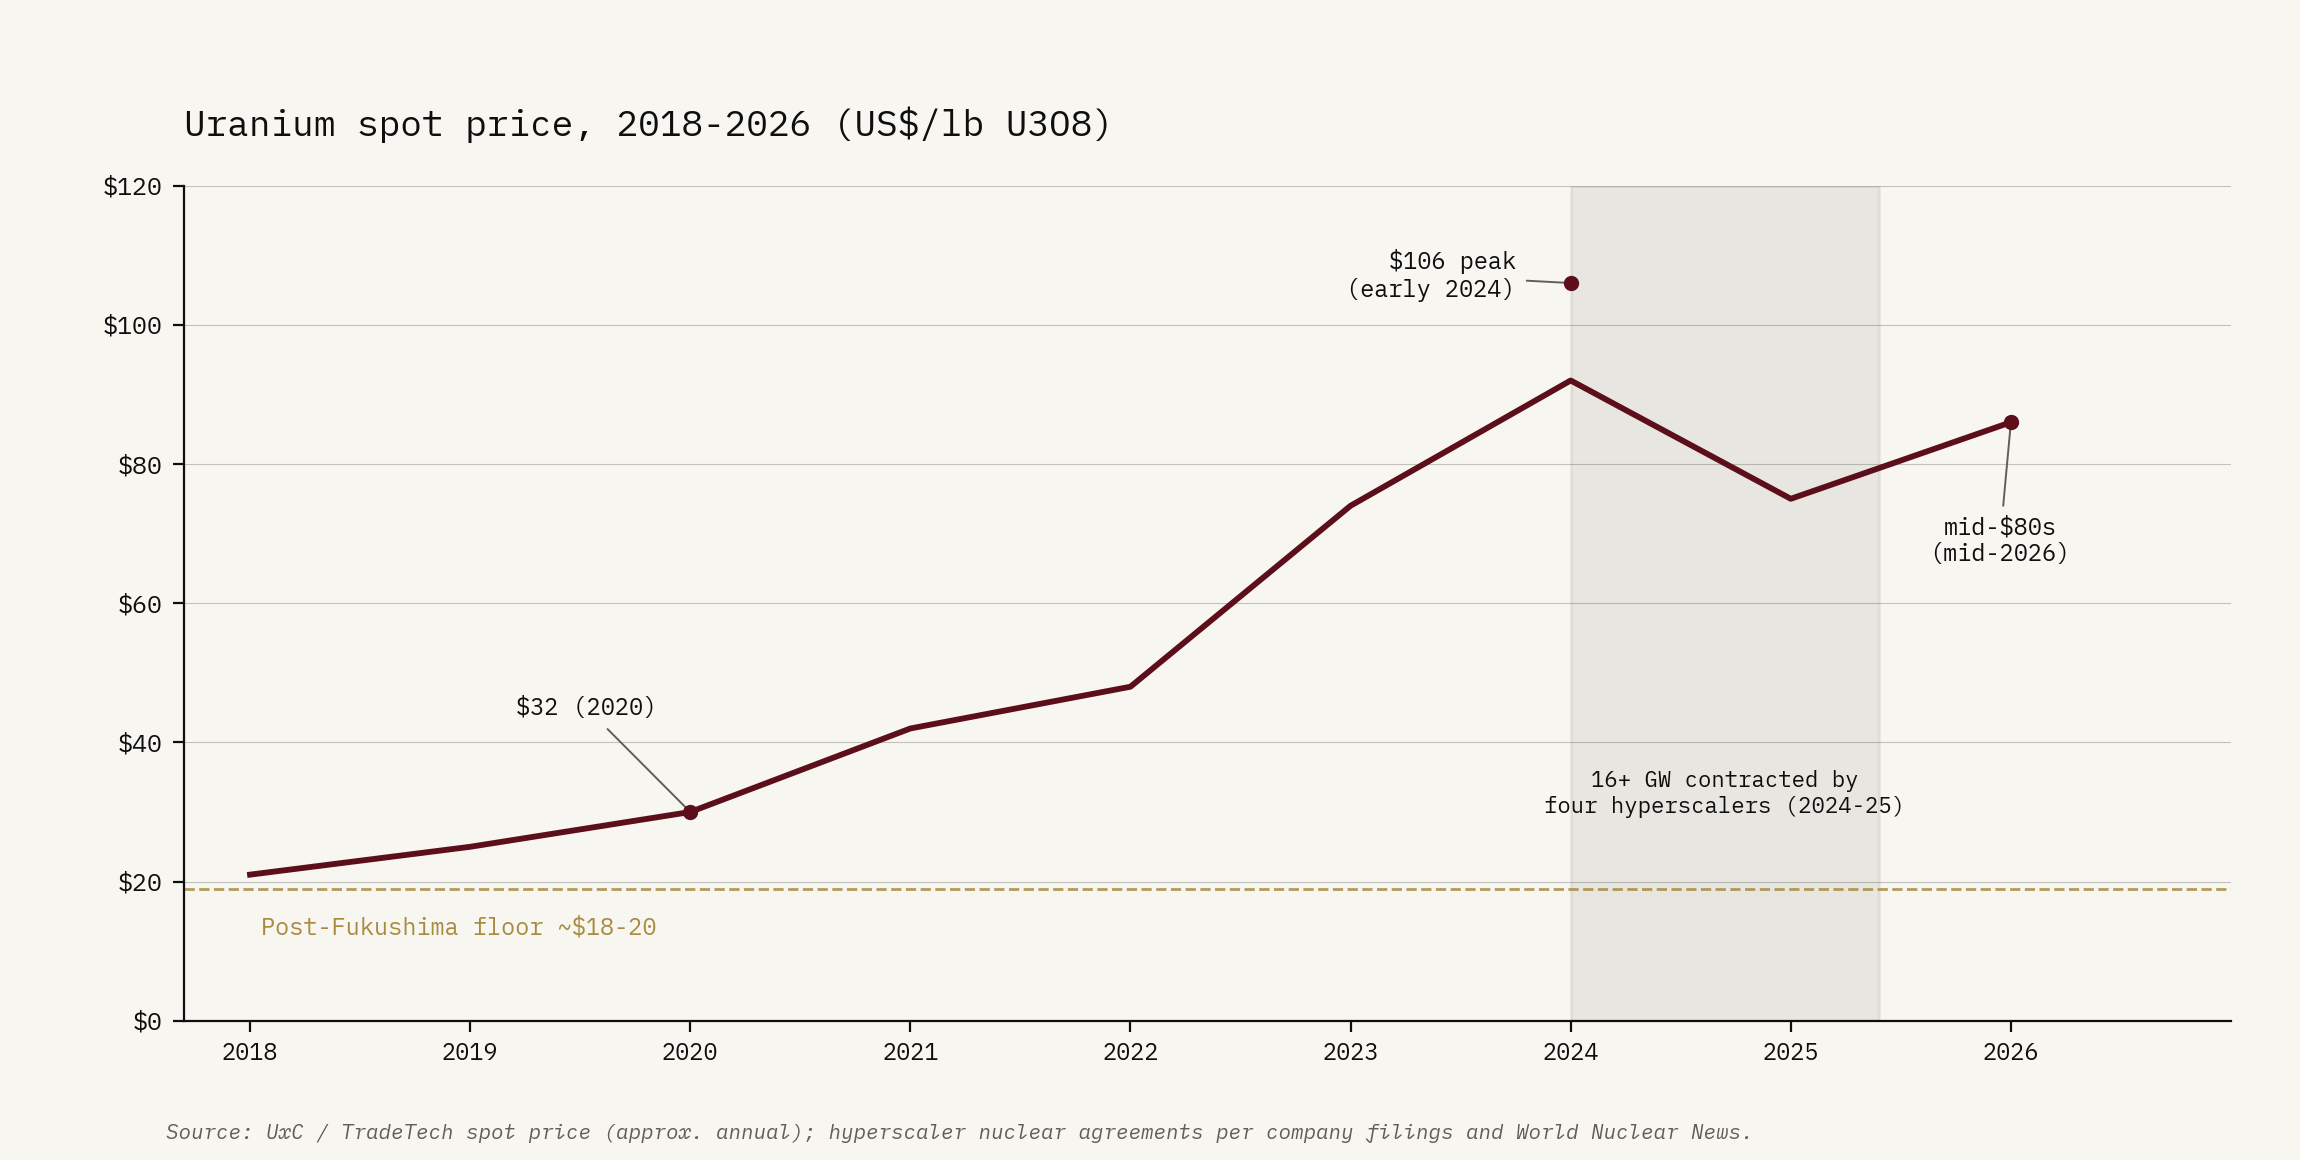
Uranium spot price, 2018–2026 (US$/lb), with hyperscaler contract timeline
3. The Deep Dive — The Supply That Cannot Follow
The geology of a deadline
The numbers above are all demand. What turns them into a constraint sits on the other side of the ledger, and it is the kind capital and policy cannot vote away: it is geological, and it is slow.
A copper mine takes, on average, 17.9 years to go from discovery to first production. In the United States the permitting layer alone stretches that to 29 — and those 29 years are dead time: the first commercial tonne does not reach the surface until they are over. Nothing else in heavy industry runs on that clock. A shale well flows within months of the decision to drill; a chip fab is standing in two or three years; a copper project in Arizona, threading federal, state, tribal and environmental review, takes the better part of a working life.
Watch what that does to the pipeline. S&P Global counts 239 major copper discoveries since 1990 — but only fourteen in the most recent decade, holding 3.5% of all the copper found across the period, and a mere four in the five years to 2023. Meanwhile the average grade coming out of the ground has dropped 40% since 1991, so every refined tonne now means grinding through far more rock than it did a generation back. The industry has not stopped looking. It keeps finding, instead, that the easy ore is already spent.
This is the part we want to sit with, because it is what the financial commentary consistently underweights. Meeting 2035 demand needs north of $210 billion in fresh mine development. The industry has put up $76 billion in six years — under half the pace required. Money, in other words, is not the binding constraint; the mines are. And no project that has yet to break ground arrives in time to matter this decade.
Silver: the preview
Of the three markets in this issue, silver is the one we keep returning to — not because it is the largest prize, but because it has already done what we expect copper and uranium to do, in full view, with every stage on the record. The collision this issue describes — demand locked in faster than supply can answer — is not a hypothesis here. It happened, and it is still happening.
The deficit and the price move are the setup, already on the board: five straight shortfalls, the metal doubling inside a year. What turns that from a commodity story into a template is the stage the textbook says should have closed the gap. Solar manufacturers, squeezed between falling module prices and a rising silver bill, went to war on their own consumption: thinner deposits, redesigned cells, copper substituted wherever the engineering allowed it. It worked. Photovoltaic offtake fell 6% in 2025, and the Silver Institute expects a further 19% this year. Industry did exactly what industry is supposed to do when an input turns dear — and the market stayed in deficit anyway.
That “anyway” is the entire lesson. The ounces industry handed back were absorbed, and then some, by silver’s other buyer: investment demand, private and institutional money treating the metal as the smaller sibling of the gold that central banks have spent three years hauling in by the thousand tonnes. One motor responds to price; the other does not. The investment bid is monetary, not industrial — it tracks the same sovereign-debt and reserve pressures that drive the central-bank gold accumulation, and a buyer moving for those reasons does not trim its position because a panel maker found a way to use less silver. The two motors sit on different axes, and only one of them can be engineered away.
So when we call silver the preview, we mean it as precisely as that. Copper and uranium are walking into the conditions silver met in 2021, with one difference that should sharpen our attention: their demand has nowhere to hide. Grams of silver per cell can fall. A transmission line offers no such exit — copper’s conductivity is bought by the tonne or not at all, and a reactor burns the fuel its physics dictates, to the gram. When these markets arrive where silver already stands, the rationing falls on price, and on nothing else.
Uranium: the contracted renaissance
What sets uranium apart from copper and silver is that its incremental demand is not diffuse or statistical. It has names on it, signatures, a price.
Sixteen-plus gigawatts of nuclear capacity, contracted by four technology companies inside two years, is a single traceable event with a fuel requirement attached. And it lands on a market that was already short: the world’s reactors consume more uranium than its mines produce, and have for years. Today’s gap is met from secondary supply — drawn-down inventories and material recycled out of decommissioned weapons programs — and that cushion is both finite and thinning. Onto that already-short market the data-center agreements stack a new and harder layer of demand, amplifying a shortfall that was structural years before they were signed.
The supply side is concentrated to a degree that should give any buyer pause. Kazakhstan produced roughly 40% of the world’s uranium in 2025, and Kazatomprom, its state producer, has announced a deliberate 10% cut for 2026 — pulling barrels from the dominant source exactly as demand turns up. Washington, meanwhile, has legislated a ban on Russian imports that reaches full force in December 2027, closing another door for Western utilities and sharpening the scramble for Canadian, Australian and Kazakh material. Cameco, the largest Western producer, covers about a sixth of world output. There is not much slack in that list.
The price has already moved once, and hard: from $32 a pound in 2020 to $106 at the early-2024 peak; after retreating into 2025 it has climbed again, and trades in the mid-$80s today — more than four times its post-Fukushima low. New long-term contracting ran to some 119 million pounds in 2024, with term prices at fourteen-year highs. The utilities that stopped contracting for a decade after Fukushima are back at the table, and the order in which they arrive matters: the early movers lock in supply, the laggards bid for whatever a pipeline starved of capital for fifteen years can still offer.
By 2040, on the World Nuclear Fuel Report’s central scenario, annual reactor demand reaches 397 million pounds — more than double the 2025 requirement — and the report’s conclusion is blunt: primary mine production will not meet it. The largest producing mines deplete through the 2030s, and the development timeline for a new one now runs ten to twenty years. The reactors are already built. They need fuel.
4. Asset Class Watch — Who Holds the Ground
The refining chokepoint
The preceding section describes the supply side in terms of mines. The mine is not, however, the end of the supply chain. Between the mine and the data center lies a refinery or smelter, and at that stage of the chain, the map changes dramatically.
China produces approximately 50% of the world’s refined copper and has accounted for 97% of the growth in global copper smelting and refining capacity since 2000. Not 97% of supply — 97% of growth. The rest of the world built almost nothing for a quarter of a century, and every incremental tonne of capacity came from one country. For rare earth processing the figure is 80 to 90% of global throughput. For lithium refining, 65 to 70%.
The mine may be in Chile, the cobalt in the Democratic Republic of Congo, the uranium in Kazakhstan. The refined product — cathode copper, separated rare earth oxide, battery-grade lithium carbonate — arrives overwhelmingly from Chinese facilities. This is not an accident of geography. It is the outcome of sustained industrial policy, subsidized energy, patient capital, and two decades during which the rest of the world largely delegated the unpleasant, capital-intensive work of processing raw materials.
In December 2024, China demonstrated what that concentration implies in practice. Export controls on gallium, germanium, antimony, and superhard materials to the United States took effect; graphite exports were restricted. The immediate price response: gallium up 365%, germanium up 400%, antimony up 437%. The controls were suspended in November 2025, through November 2026 — a tactical pause, not a structural reversal. Read the calendar: the suspension expires a year before the US ban on Russian uranium reaches full force in December 2027. The leverage has been demonstrated and priced; now it sits parked, recoverable at exactly the moment Western utilities lose the Russian option.
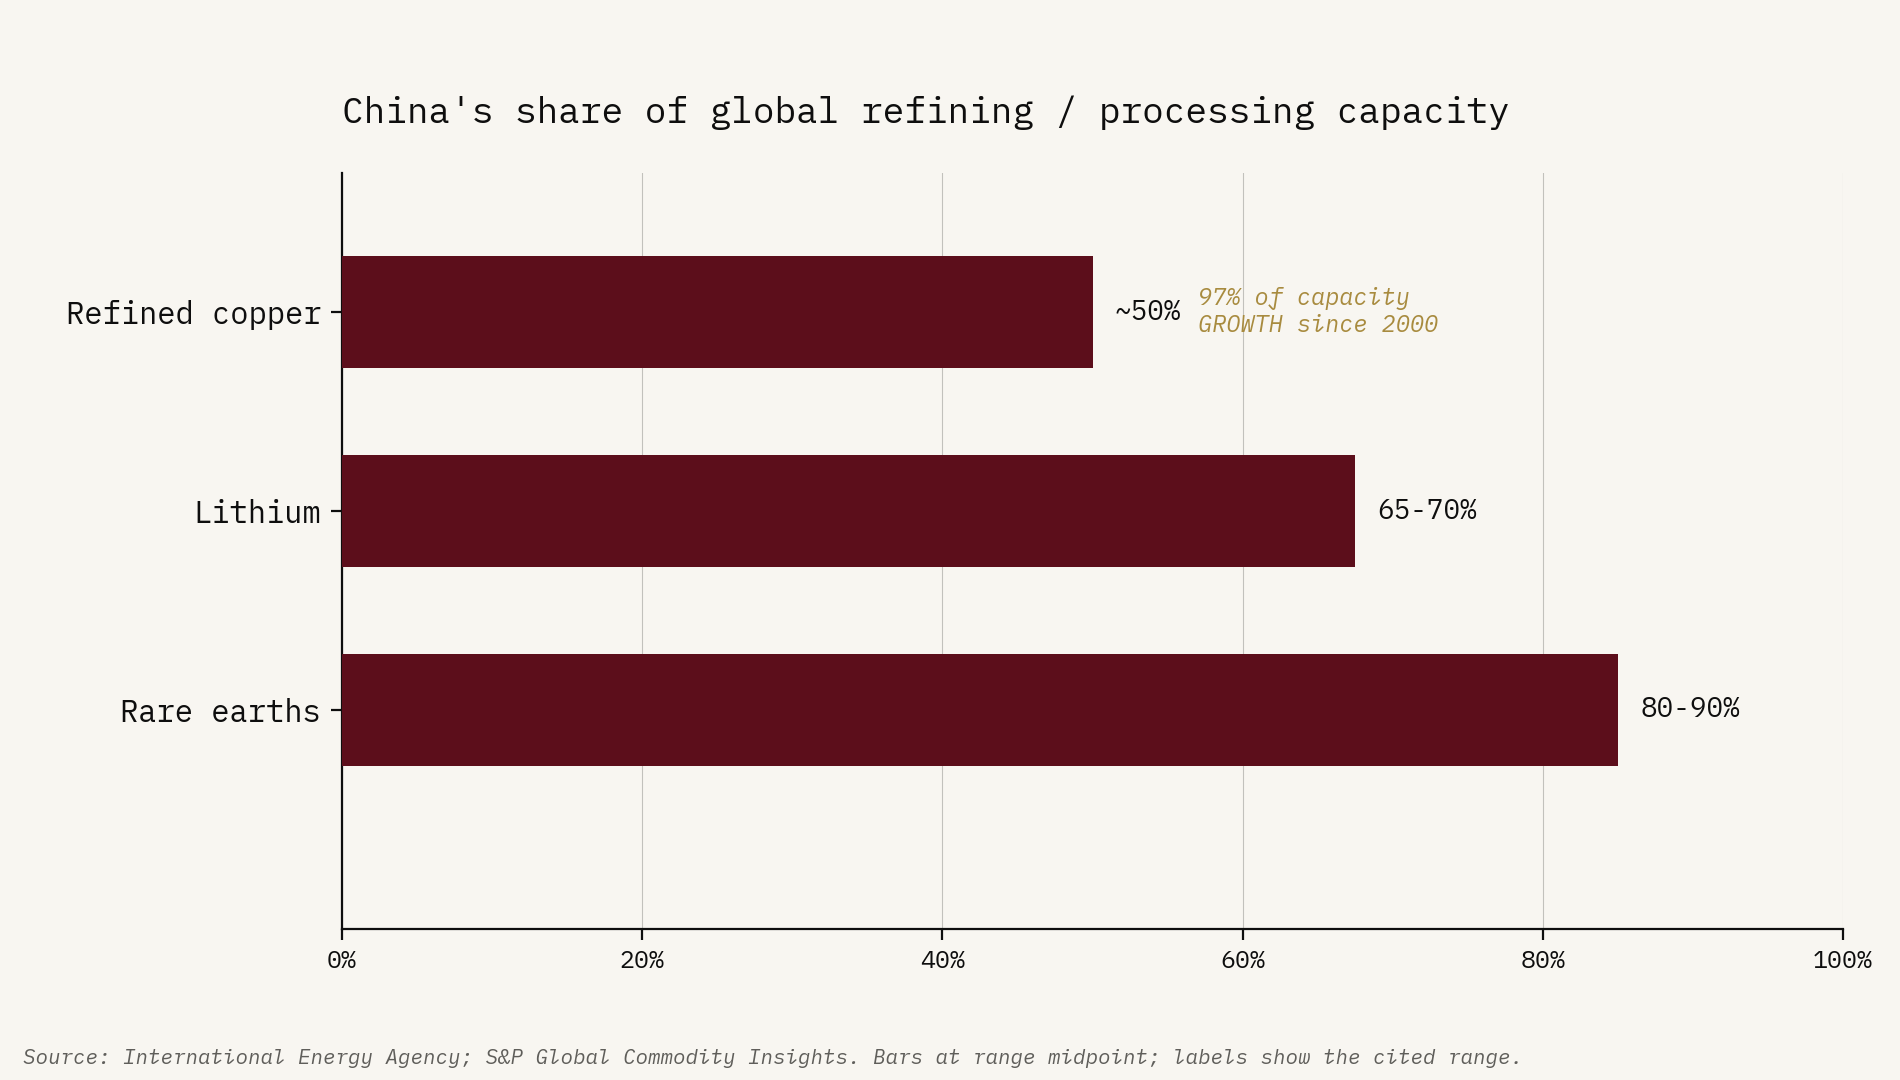
China’s share of global refining/processing capacity: copper, rare earths, lithium (%)
Regional arithmetic
Against that backdrop, the geography of the transition has a shape.
Latin America — the triangle. Chile, Peru, and Argentina together hold the largest concentrations of mineable copper and lithium reserves on earth. Chile alone accounted for roughly 27% of global copper mine production in 2024. These are the reserves the world needs. The question defining the region’s trajectory over the next decade is whether it captures more of the value chain — processing and refining, not only extraction — as the Western world attempts to build alternatives to Chinese capacity. The incentive has changed; the infrastructure has not yet followed.
Canada and Australia — the Western alternative. Both carry significant uranium production, growing lithium assets, and the institutional stability that has become a genuine differentiator as supply-chain risk is repriced geopolitically. They are building refining capacity, and their permitting timelines run substantially faster than the US system — Australia roughly seven years mine-to-production, Canada closer to ten. In a race where time is the primary constraint, that gap is not trivial.
The United States paradox. The country that will consume the largest share of these materials — in data centers, in vehicles, in grid infrastructure — has among the richest unmined deposits in the developed world: copper in Arizona and Montana, uranium in Wyoming and New Mexico, lithium in Nevada. And an average permitting timeline of 29 years. The $720 billion of grid investment required by 2030 will draw on copper refined overwhelmingly outside the United States, processed in capacity built overwhelmingly by China. Washington has noticed: copper and uranium now sit on the federal critical-minerals list, a cabinet-level council exists to accelerate permitting, and individual reviews have been fast-tracked by executive order. That is the political recognition of the problem. It is not yet the solution — an order can compress a review; it cannot conjure the smelter, the workforce, or the seventeen missing years.
Europe — the structural position. Minimal domestic production, the most restrictive permitting environment among developed economies, and a dependency on supply chains it does not control. The situation rhymes with the continent’s pre-2022 posture on natural gas: the vulnerability was documented well in advance, repeatedly, by people who understood the arithmetic. Nothing was done until inaction became untenable.
The exposure that isn’t there
Read as an asset-class question, the map above ends somewhere uncomfortable. The investor who owns the AI story through a broad US index — a position this letter measured last month at nearly 40% in seven names — owns the mind of the machine: the chips, the models, the platforms. That position contains almost nothing of the machine’s body. The miners are a rounding error in the index beside the companies they supply, and the metals themselves are absent entirely. The market has paid historic multiples for the layer of the build-out that is abstract and crowded, and left the layer that is physical and constrained to be priced by industrial buyers discovering what multi-decade commitments cost.
The asymmetry sharpens on inspection, because the demand for the materials is being contracted by the very companies the index investor already holds. Microsoft’s reactor restart, Amazon’s 1,920 megawatts, Meta’s gigawatts — the balance sheets the market prices for their software economics are underwriting, on the liability side, the scarcity of copper, fuel, and grid capacity. One story, two legs. The capital has crowded into the leg that can be repriced in an afternoon, and ignored the leg that has to be dug out of the ground.
5. How We Are Reading This
We are convinced — not as a macro hypothesis but as a matter of arithmetic — that the materials at the core of the AI infrastructure build-out face a structural supply constraint that the financial cycle cannot dissolve and that the present decade cannot close.
The demand side is not a forecast. The hyperscalers’ twenty-year nuclear purchase agreements, the utility capital programs approved by regulators, the data-center interconnection queues already filed with grid operators — these are commitments of a different character than equity valuations or earnings estimates. A financial correction does not cancel a signed nuclear purchase agreement; a recession defers construction by quarters, not decades. The physical order book is real, it is large, and it belongs to the decade ahead — no repricing of the companies that signed it will unwind a foundation already poured.
The supply side runs on a geological clock that does not respond to the financial cycle. A mine that does not exist cannot be willed into production by a rate cut or a government subsidy; it arrives in decades, not quarters, and the global pipeline of projects under development covers less than half of projected demand. The price signal has been in place for years — copper more than tripled from its 2016 lows, uranium repriced from $32 to $106 in four years. The capital has not followed fast enough to close the gap, because capital cannot compress geological time.
In our reading, copper, silver, and uranium are the three materials that sit simultaneously at the intersection of the AI infrastructure build-out, the global energy transition, and the monetary disorder this publication has been tracking since its first issue. Copper is the only conductor available at volume and scale for every technology in the transition — the data center, the transmission line, the electric vehicle, the nuclear plant. There is no substitute for it at the required scale, and the mine development pipeline cannot meet the demand trajectory within the decade. Silver carries the double exposure no other industrial metal holds — the industrial market and the monetary market drawing on the same supply base, with five consecutive deficits on the ledger and a 2025 that settled which of the two motors sets the marginal price. Uranium powers the baseload that the entire AI infrastructure ultimately depends on, with demand now institutionally committed at a scale without precedent in the fuel’s history, from the dominant-producing country that has just announced a production cut.
The objection writes itself: the data center is one demand stream among several, and the energy transition would strain these markets with or without it. True — and it misses what the new stream is made of. Transition demand is policy-shaped: mandates soften, subsidies lapse, targets slip. The AI stream arrives contracted — power agreements signed, interconnection queues filed, capital committed against delivery — and it lands on a transition pipeline that was already short of metal, competing for the same grid and transformers and copper that pipeline already needed. The accelerant is not the size of the new demand. It is its hardness.
We do not hold the view that these metals appreciate smoothly or on any particular schedule. Industrial commodities sell off in financial crises — that is a reliable pattern and we do not expect this cycle to differ in the short run. What we hold is that the structural position does not reset with the financial cycle. The mine development clock does not restart at zero when risk assets recover, and the reactor fuel requirement does not disappear with the share price. The recovery, when it comes, returns to the same structural shortage — which, by that point, will have had additional years of demand without new supply to absorb it.
The reading would weaken — and we would print it — if the locked-in demand proved cancellable after all: physical orders rescinded at scale in the next downturn rather than deferred, substitution doing to copper at volume what thrifting has done to silver in the panel, or a permitting reform that compresses the timeline instead of expediting the paperwork around it. None of the three is in evidence.
6. Signals to Watch
The US critical-minerals permitting pipeline. Resolution Copper in Arizona — one of the largest undeveloped copper deposits in the world — is the test case for whether the US can compress its 29-year mine development timeline. The project’s land exchange survived the Ninth Circuit in March, and its environmental review has been expedited under the administration’s critical-minerals orders. Watch whether construction milestones follow the legal ones: the distance between an accelerated review and a producing mine is where the permitting problem either begins to close or proves immune to executive orders.
Kazatomprom production guidance. The announced 10% production cut from the world’s dominant uranium producer is the most immediate supply lever in the fuel market. Any revision — upward on price incentive, or further downward on depletion or political constraint — shifts the supply/demand balance that utilities are currently contracting around.
Chinese processing restrictions — renewal or expansion. The December 2024 controls on gallium, germanium, and antimony were suspended through November 2026. Their renewal, extension to copper or silver precursors, or replacement by a more permanent mechanism would represent a structural escalation in the critical-minerals standoff. The suspension lapses thirteen months before the US ban on Russian uranium reaches full force; what Beijing does at that expiry is the clearest available read on how deliberately it intends to play the position.
Silver’s sixth deficit — the test of the second motor. The Silver Institute forecasts a sixth consecutive market deficit for 2026, near 46 million ounces, even as thrifting cuts photovoltaic demand by roughly a fifth. That combination is the signal: if the deficit holds while industrial users retreat, the monetary motor is confirmed as the marginal buyer and the silver reading in this issue strengthens. If the market swings to surplus, the squeeze was industrial after all. Interim Silver Institute updates and the flow into coins, bars, and exchange-traded holdings are the running scoreboard.
Utility uranium contracting pace. Long-term nuclear fuel agreements are the forward-looking indicator for how the industry reads supply availability in the 2028–2035 window. Utilities contracting aggressively at term prices near fourteen-year highs signal that the buyers who know this market best do not expect conditions to ease. Watch contract volumes and term prices through the World Nuclear Association’s annual reports and major producer quarterly disclosures.
Sources: Wood Mackenzie Copper Demand Outlook 2025; S&P Global Commodity Insights and Market Intelligence; International Energy Agency Critical Minerals report; US Department of Energy data-center electricity report; Goldman Sachs Power Up report; NERC 2025 Long-Term Reliability Assessment; Silver Institute World Silver Survey 2026; World Nuclear Fuel Report 2025; Kazatomprom production reports; company filings and World Nuclear News for hyperscaler nuclear agreements.
— Threshold